Developed economies continue to play a critical role in the global economy although some emerging markets present astonishing opportunities for investors and businesses. The growth of developing countries is often seen as the potential for high growth, leaving a misperception that developed countries are less likely to generate meaningful profits as they have reached their developmental peak. However, the G-7 countries, the largest developed economies that are home to about 10% of the population in the world, account for 27% of the gross domestic product (GDP) and 14% of growth during the period of 2012-2022. On the other hand, the 152 developing nations, accounting for 85% of the entire 6.7 billion population, yielded less than 40% of the global economic output in total in 2021. In recent years, these seven economic giants have partnered with the European Union (EU) and are playing an increasingly significant role in reshaping the structure and orders of trade, services, and financial services. The recent Ukraine-Russia war has further strengthened the relationship between the G-7 countries and the EU. Thus, an analysis of the economic developments and, more significantly, the outlook of these economies can be useful for business decisions.
Using the data collected by Consensus Economics, a London-based international macroeconomic survey firm, Table 1 presents the summary statistics of GDP growth rates of the G-7 countries and the Eurozone (not all EU 27 members) in 2022. These values are estimated by various economic research institutions, including Goldman Sachs, Moody's Analytics, Citigroup, International Monetary Fund (IMF), etc. Since they were estimated at the end of the year, small standard deviations indicate similar views on the realized economic growth in all nations across various experts. The world average growth rate was 3.2%, according to IMF, which was lower than in 2021, due to a low comparison basis in 2020 as the global economy was severely impacted by COVID-19.
Table 1. The GDP growth in 2022
This table reports the summary statistics of GDP growth forecasts by various institutions for G-7 countries and the Eurozone in December 2022.
|
Country (%) |
Mean |
St. Dev |
# Forecasts |
|
Canada |
3.36 |
0.17 |
16 |
|
France |
2.49 |
0.07 |
27 |
|
Germany |
1.70 |
0.14 |
30 |
|
Italy |
3.70 |
0.12 |
25 |
|
Japan |
1.49 |
0.10 |
22 |
|
U.K. |
4.37 |
0.11 |
24 |
|
U.S. |
1.90 |
0.08 |
26 |
|
Eurozone |
3.23 |
0.06 |
30 |
|
World |
3.20 |
|
|
Data sources:Consensus Economics; International Monetary Fund
In terms of individual countries, the U.K. and Italy had higher growth rates than the other five countries and outperformed the Eurozone’s 3.23%, which was similar to the world average estimated by the IMF. However, the variation among the member countries, like Germany vs. Italy, is not trivial. The U.K. and Italy outperform the other G-7 members with growth rates of 4.37% and 3.70%, respectively. In contrast, the U.S., Germany, and Japan are expected to underperform with growth rates of 1.90%, 1.70%, and 1.49%, respectively.
The differences in growth among countries in 2022 could be mainly attributed to the variation in response to labor market shortages and supply chain disruptions caused by the Ukraine-Russia war, which lead to soaring production costs. As for outperformers, the fiscal policy by the Italian government and strong exports boost consumer spending and investments, supporting demand and economic growth. The stronger performance of the U.K. could be attributed to its success in negotiating new trade post-Brexit deals with several countries, which could have lowered the uncertainty of economic policies.
In contrast, Germany's weaker performance could be attributed to its dependence on the automotive industry, which has been impacted by supply chain disruptions and the shift towards electric vehicles. Japan's weak growth rate could be attributed to its aging population and slow progress in implementing structural reforms to boost growth. The U.S.'s underperformance could be attributed to supply chain disruptions and the impact of the war on production costs.
Stock markets reflect the expectation of future economic growth as factors such as GDP growth, inflation, interest rates, and geopolitical events can influence its performance and risk. The standard deviation of stock market returns is to measure the volatility over the period. As demonstrated in Table 2, stock markets overall showed different levels of performance and risk over various years. In 2017 and 2019, the stock markets performed relatively well with lower volatility but did not perform well with high volatility in 2018. In 2020, the COVID-19 pandemic significantly impacted the stock markets over the world. Some countries such as the U.S., Japan, and Germany resulted in high risks but also high returns.
Table 2. National stock market performance of the G7 countries
This table reports the summary statistics of GDP growth forecasts by various institutions for G-7 countries and the Eurozone in March 2023.
|
Return |
U.S. |
Japan |
Germany |
Canada |
Italy |
France |
U.K. |
|
Year |
|
|
|
|
|
|
|
|
2017 |
0.1850 |
0.2361 |
0.2774 |
0.1757 |
0.2978 |
0.2901 |
0.2251 |
|
2018 |
0.0666 |
0.0487 |
0.0186 |
0.0202 |
0.0608 |
0.0726 |
0.0507 |
|
2019 |
0.2496 |
0.1442 |
0.1681 |
0.2151 |
0.2121 |
0.2233 |
0.1555 |
|
2020 |
0.1405 |
0.1526 |
0.0889 |
0.0798 |
0.0074 |
0.0392 |
-0.0682 |
|
2021 |
0.2249 |
0.0320 |
0.0622 |
0.2201 |
0.1404 |
0.1996 |
0.1805 |
|
2022 |
-0.1862 |
-0.1883 |
-0.1762 |
-0.0922 |
-0.0851 |
-0.0634 |
-0.0045 |
|
2023 (01.01-04.14) |
0.2385 |
0.2108 |
0.5333 |
0.2476 |
0.5269 |
0.5597 |
0.2788 |
|
Volatility |
|||||||
|
Year |
|
|
|
|
|
|
|
|
2017 |
0.0605 |
0.0817 |
0.1061 |
0.0835 |
0.1514 |
0.1107 |
0.0972 |
|
2018 |
0.1365 |
0.1351 |
0.1503 |
0.1318 |
0.1781 |
0.1439 |
0.1327 |
|
2019 |
0.1071 |
0.1022 |
0.1375 |
0.0998 |
0.1412 |
0.1243 |
0.1235 |
|
2020 |
0.3208 |
0.2506 |
0.4198 |
0.3634 |
0.4139 |
0.4143 |
0.3984 |
|
2021 |
0.1194 |
0.1499 |
0.1398 |
0.1519 |
0.1654 |
0.1613 |
0.1559 |
|
2022 |
0.2267 |
0.1888 |
0.3031 |
0.2194 |
0.3144 |
0.2836 |
0.2174 |
|
2023(01-02) |
0.1499 |
0.1501 |
0.2291 |
0.1368 |
0.1939 |
0.1988 |
0.1195 |
Data sources: Authors; Yahoo! Finance
The post-COVID two years were commonly characterized by high volatility. In 2021, the stock markets showed signs of rebounding from the pandemic's impact. Among them, the U.S., France, the U.K., and Canada had an average performance higher than 10% with reasonable risk. Since early 2022, high inflation caused by labor shortages, wars, and energy and food price increases led to greater volatility and losses in some countries, such as the U.S., Japan, and Germany. The equity values in all the G-7 countries recovered from their previous losses with lower volatilities in the first quarter of 2023. From 2022, markets were more volatile and had some downturns due to labor shortages, war, and the increase in energy and food prices. The markets in the U.S., Japan, and Germany suffered significant losses compared to other countries.
Among the G7 countries over the past seven years, the U.S. stock market has been the most consistent performer, yielding positive returns every year except in 2022. The lowest volatility of indicates the U.S. stock market a relatively stable investment opportunity. On the other hand, the Japanese stock market has had the highest volatility in four out of the past seven years with mixed results. Germany has also had mixed results, with positive returns in 2017 and 2019, but negative returns in 2018, 2020, and 2022. The German stock market has also had relatively high volatility in the past seven years.
Table 3 summarizes the statistics of the projected GDP growth for the G-7 countries and the Eurozone in 2023 and 2024 based on the forecasts of various institutions. Thanks to improved business and consumer confidence, declining food and energy prices, and the reopening of China, the global GDP is expected to grow by 2.70% in 2023 and further rise to 3.20% in 2024. However, the economic growth of G-7 countries is generally expected to underperform the rest of the world. As of March 2023, the forecasts suggest that Japan is expected to have the best economic performance among all G-7 countries, with a growth rate slightly higher than 1%. European countries are not expected to perform as well as they did in 2022, with the entire Eurozone expected to grow by only 0.61%. Germany and the U.K. are both expected to face minor economic downturns. Furthermore, observing the lowest estimates shows that, except for the U.S. and Japan, there is a risk of recession in the other five countries, with the U.K. being the highest risk.
Table 3. GDP growth forecast: 2023 and 2024
|
(%) |
Year |
Mean |
High |
Low |
St. Dev. |
# Forecasts |
|
World |
2023 |
2.70 |
|
|
|
|
|
|
2024 |
3.20 |
|
|
|
|
|
Canada |
2023 |
0.62 |
1.00 |
-0.71 |
0.38 |
17 |
|
2024 |
1.40 |
2.30 |
0.40 |
0.47 |
17 |
|
|
France |
2023 |
0.47 |
0.88 |
-0.20 |
0.26 |
21 |
|
2024 |
1.12 |
1.60 |
0.40 |
0.28 |
21 |
|
|
Germany |
2023 |
-0.02 |
0.70 |
-0.90 |
0.37 |
29 |
|
2024 |
1.35 |
2.14 |
0.40 |
0.48 |
29 |
|
|
Italy |
2023 |
0.57 |
1.05 |
-0.01 |
0.26 |
21 |
|
2024 |
1.05 |
1.50 |
0.55 |
0.29 |
19 |
|
|
Japan |
2023 |
1.04 |
1.76 |
0.08 |
0.38 |
25 |
|
2024 |
1.12 |
1.68 |
0.51 |
0.33 |
23 |
|
|
U.K. |
2023 |
-0.49 |
0.04 |
-1.80 |
0.35 |
25 |
|
2024 |
0.72 |
2.00 |
-1.40 |
0.68 |
25 |
|
|
U.S. |
2023 |
1.01 |
1.89 |
0.30 |
0.35 |
28 |
|
2024 |
0.87 |
1.96 |
-0.50 |
0.67 |
28 |
|
|
Euro |
2023 |
0.61 |
1.20 |
-0.10 |
0.33 |
29 |
|
2024 |
1.09 |
1.90 |
0.10 |
0.42 |
29 |
Data sources: Consensus Economics; International Monetary Fund
Global economic growth is expected to slightly improve in 2024, but there is still uncertainty in this forecast, as indicated by the standard deviation, due to geopolitical risks and economic policies. The predicted growth rate for Eurozone, overall, is 1.09%, with Germany and the U.S. projected to grow by 1.35% and 0.87%, respectively. France, Italy, and Japan are all expected to grow at around 1.1%, while the U.K. is expected to grow at the slowest pace among the peer countries. The high inflation starting from early 2021 that has plagued Europe and North America (in fact, countries all over the world) is projected to gradually slow down after the second half of 2023. The inflation rate for Eurozone is expected to decrease from 8.1% in 2022 to 5.9% in 2023, and further to 4.5% in 2024, mainly due to the effects of tightened monetary policy, much stabler energy prices, and decreasing food prices. However, pressures from rising service costs and increasing salaries caused by tightening labor market supplies may still result in continued inflation measured by the core consumer price index (Core CPI). This may leave major central banks around the world to maintain high policy rates as the policy option before the third or fourth quarter of 2024.
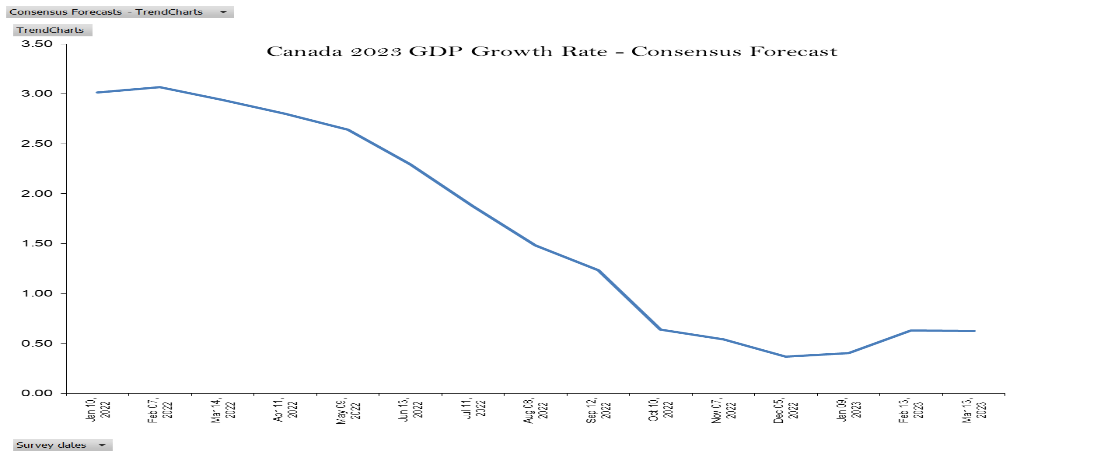
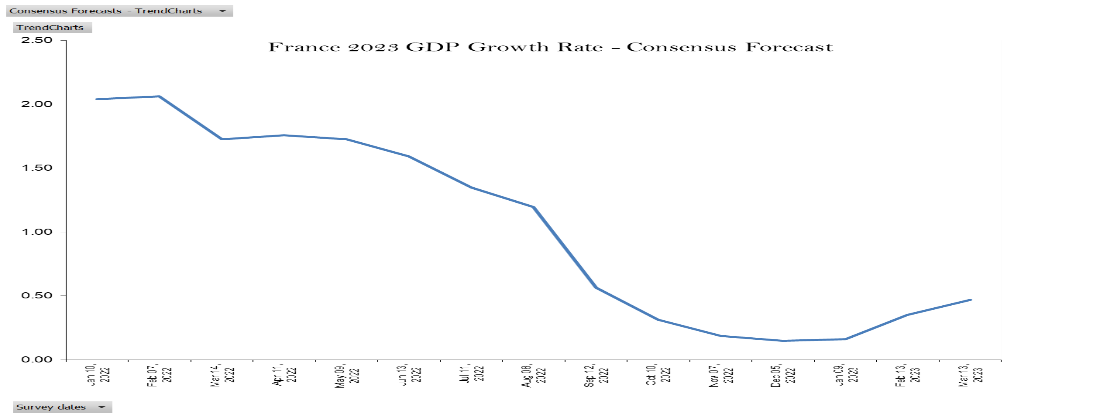
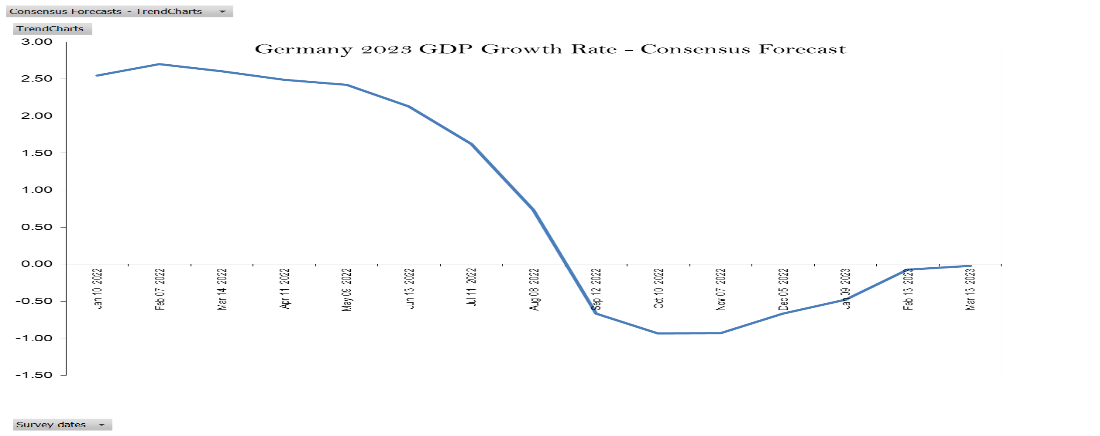
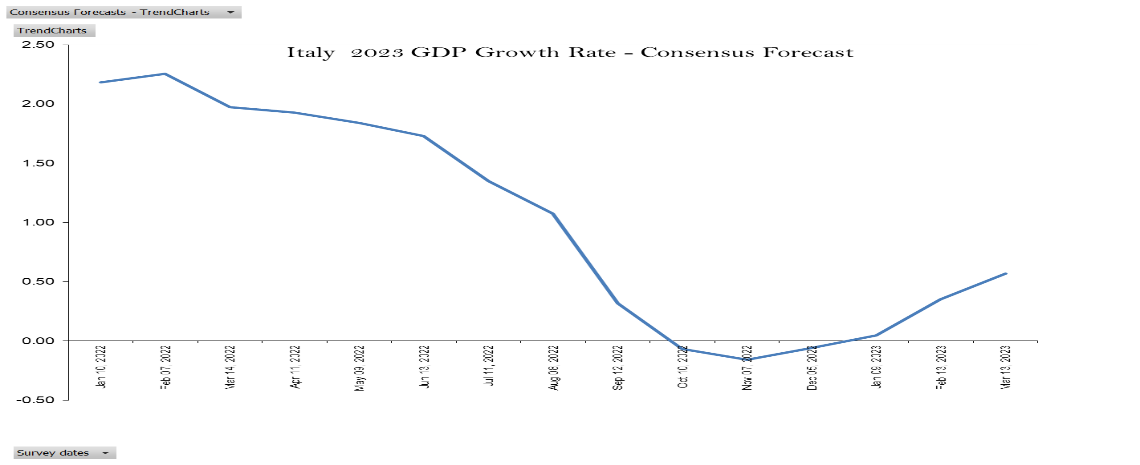
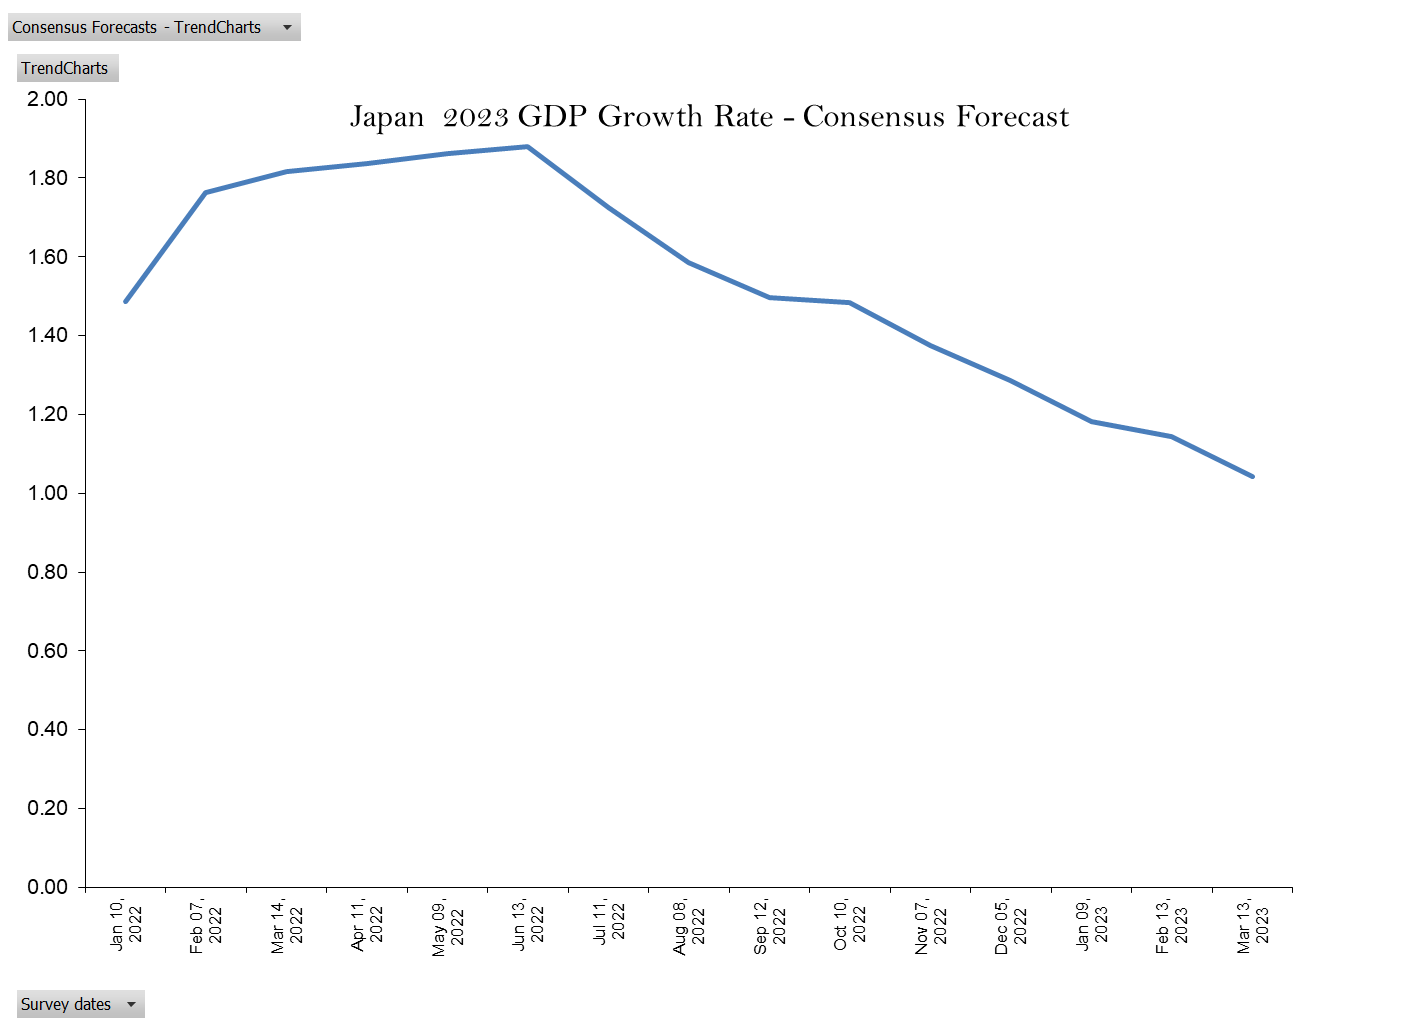
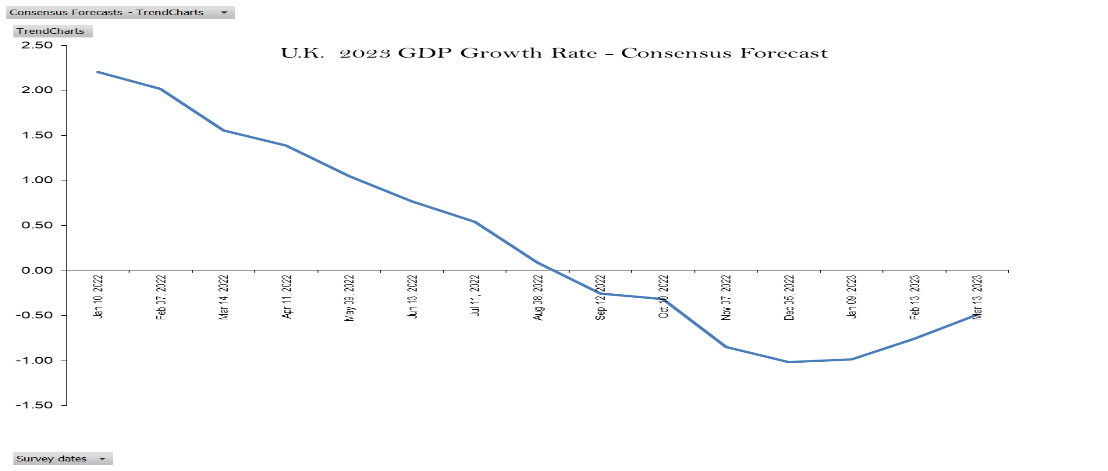
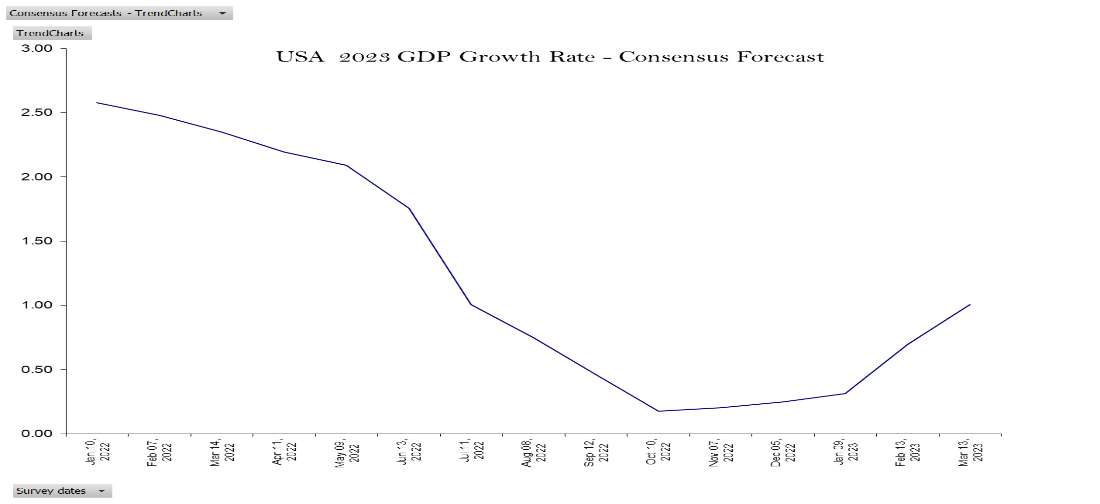
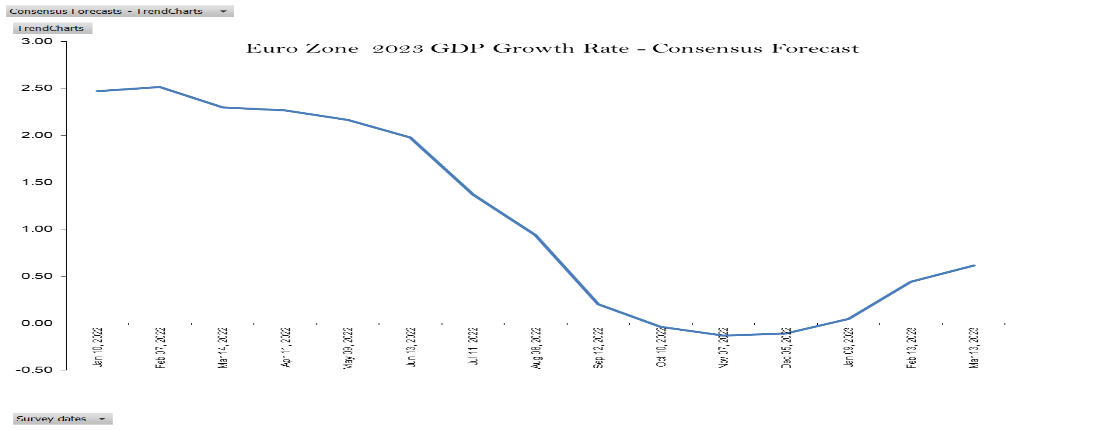
The graphs in Figure 1 show the trends of the forecast in various countries and provide a clearer view of the changes in the outlook of 2023 economic growth in each country over the recent 15 months. Except for Japan, Most of G-7 countries generally experienced a downward revision of their economic forecasts downward from the beginning of 2022, ranging from about 2.5% to 4% lower than the estimated value in the fourth quarter of 2022, until after earlier 2023, when gradually the projections began to be more modestly optimistic. However, the economic prospects are not as good as they were in the first half year of 2022, especially for Germany and the U.K. The revisions to the growth of Japan in 2023 were still positive until the end of the second quarter of 2022. It was only in the third quarter that they began to revise downward, and as of March 2023, there were no signs of a bottom. As the window of the economy, the stock markets of the G-7 countries experienced a decline collectively that is rarely seen in history.
Figure 1. The time trend of projected GDP growth rate by the analysis institutions: 2022:01 – 2023:03
The graphs show the time series of the average 2023 GDP growth forecasts by the professional institutions of each of the G-7 countries and the Eurozone
A. Canada

B. France
C. Germany
D. Italy
E. Japan
F. U.K.
G. U.S.
H. Eurozone
Data: Consensus Economics
The next critical question is how the performance of each component of the economic system will affect overall growth in each country. We pay particular attention to two aspects of domestic economic activities: consumption and investment. Tables 4 and 5 show that the main drivers of economic growth vary widely across different countries. As the largest single market in the world, both investment and consumption in North America are expected to slow down in 2024 compared to 2023, in particular, investment in Canada is expected to face a downside risk in 2024.
Table 4. Consumption growth forecast: 2023 and 2024
This table reports the summary statistics of consumption growth forecasts by various institutions for G-7 countries and the Eurozone in March 2023.
|
(%) |
Year |
Mean |
High |
Low |
St. Dev. |
# Forecasts |
|
Canada |
2023 |
1.30 |
2.50 |
0.28 |
0.53 |
16 |
|
2024 |
1.52 |
3.10 |
0.30 |
0.67 |
16 |
|
|
France |
2023 |
-0.05 |
0.60 |
-1.11 |
0.40 |
21 |
|
2024 |
1.16 |
2.00 |
0.10 |
0.46 |
20 |
|
|
Germany |
2023 |
-0.14 |
2.28 |
-1.34 |
0.70 |
28 |
|
2024 |
1.52 |
3.00 |
0.70 |
0.60 |
28 |
|
|
Italy |
2023 |
0.76 |
1.97 |
-0.10 |
0.53 |
19 |
|
2024 |
0.89 |
1.59 |
0.30 |
0.39 |
17 |
|
|
Japan |
2023 |
1.47 |
2.64 |
0.70 |
0.37 |
25 |
|
2024 |
0.93 |
2.01 |
0.23 |
0.42 |
23 |
|
|
U.K. |
2023 |
-0.65 |
0.42 |
-2.00 |
0.57 |
22 |
|
2024 |
0.69 |
3.00 |
-1.60 |
0.92 |
22 |
|
|
U.S. |
2023 |
1.32 |
2.31 |
0.60 |
0.42 |
28 |
|
2024 |
0.83 |
2.19 |
-1.30 |
0.77 |
28 |
|
|
Euro |
2023 |
0.32 |
1.12 |
-0.60 |
0.47 |
22 |
|
2024 |
1.19 |
1.76 |
0.60 |
0.33 |
23 |
Data source: Consensus Economics
Table 5. Investment growth forecast: 2023 and 2024
This table reports the summary statistics of investment growth forecasts by various institutions for G-7 countries and the Eurozone in March 2023.
|
(%) |
Year |
Mean |
High |
Low |
St. Dev. |
# Forecasts |
|
Canada |
2023 |
-1.68 |
4.20 |
-6.00 |
3.09 |
14 |
|
2024 |
1.71 |
4.30 |
-0.80 |
1.34 |
14 |
|
|
France |
2023 |
2.10 |
3.56 |
0.05 |
1.02 |
17 |
|
2024 |
1.21 |
2.50 |
0.03 |
0.76 |
17 |
|
|
Germany |
2023 |
0.31 |
3.90 |
-2.68 |
1.68 |
25 |
|
2024 |
2.88 |
5.90 |
-1.40 |
1.52 |
25 |
|
|
Italy |
2023 |
1.95 |
3.87 |
-1.30 |
1.34 |
20 |
|
2024 |
2.36 |
4.64 |
-1.60 |
1.53 |
18 |
|
|
Japan |
2023 |
2.05 |
3.44 |
0.64 |
0.82 |
19 |
|
2024 |
2.10 |
3.83 |
-1.01 |
1.08 |
17 |
|
|
U.K. |
2023 |
-0.87 |
1.01 |
-4.89 |
1.65 |
22 |
|
2024 |
-0.34 |
2.34 |
-3.23 |
1.56 |
21 |
|
|
U.S. |
2023 |
1.50 |
3.87 |
-0.48 |
0.88 |
25 |
|
2024 |
0.55 |
2.64 |
-3.46 |
1.55 |
25 |
|
|
Euro |
2023 |
0.76 |
2.80 |
-2.80 |
1.34 |
23 |
|
2024 |
1.73 |
3.40 |
0.34 |
0.69 |
23 |
On the other hand, the outlook of 2024 on the other side of the Atlantic seems to be more hopeful. The Eurozone is expected to sweep away the gloom of slowing growth. As for individual countries, investment is expected to be the main driver of growth in Germany and Italy in 2024, while consumption is also expected to be better than in 2023. In France, where sluggish private consumption in 2023 will drag down the economy, investment is expected to have a positive impact on GDP growth in 2024. The economic outlook for the U.K. does not seem as optimistic, with both consumption and investment expected to face sluggish growth or recession. In Japan, investment is expected to be the main driver of economic growth for the next two years, while consumption is expected to contribute more to economic growth in 2023 than in 2024.
In sum, our analysis indicates that these major advanced economies will face headwinds in economic growth in 2023 and 2024. The shortage of labor, the continuing impact of the disruption of supply chains, and the high costs caused by the Russia-Ukraine war, including raw materials, energy, and soaring wages, will make central banks in Europe and North America prioritize controlling inflation in making policy decisions. These factors likely trap developments in 2023, and even by 2024, making the speed of economic growth may still be not very possible to recover to historical average levels. Japan is the only country that is expected to continue with expansionary monetary policy in the foreseeable future, making its economic outlook slightly better than its G-7 peers. Thus, the pressure on economic slowdowns in Europe and North America caused by a tendency for a tightening monetary policy may negatively affect the development of industries and financial institutions.
* Paul Chiou, Director, MathWorks Lab for FinTech and Quantitative Business Analytics; Professor of Finance, Northeastern University, Boston, MA, USA