The trade war and the growth in tension between the US has China pose great challenges to the high-tech industries in the global supply chain. The global supply chain bottlenecks caused by the rapid spread of COVID-19 have caused heated discussion on the future development trend of the tech sector. This article first gives a narrative analysis on US technology import and export trade, discussing an indicator of vulnerability caused by US high-tech internationalization and dependence on imports from China. Then, it analyzes Taiwan-US high-tech intra-industry trade and the degree of integration between the two countries to further understand the direction of Taiwan-US technology cooperation.
Definition of high-tech industries
The Organization for Economic Cooperation and Development (OECD) defines the technology industry based on the ratio of R&D expenditures to revenue, and defines 194 products according to the six-digit Harmonized System (HS) classification. In 2000, although global high-tech products only accounted for 10% of added value, they accounted for 35% of world trade.
Halland Vopel (1997) selected high-tech industries based on the 4-digit Standard Industrial Classification (SIC). This article uses the industry and product comparison table of the US International Trade Commission (USITC) to compare the above industries, converts them into 8-digit HS product classification to select 842 high-tech products, and classifies these products into 13 industries. At least 767 products among this list from 1991 were imported to the US in 2020.
Preliminary analysis of high-tech trade
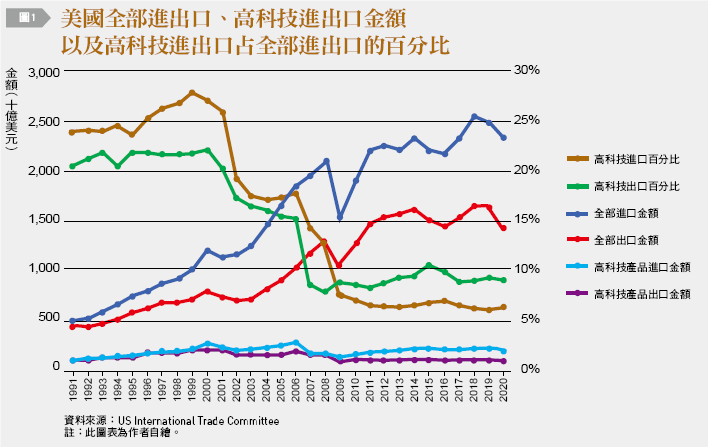
The five-year average exports of these products from 2016-2020 is US$98.7 billion. The five-year average of imports in the same period is US$215.6 billion. Figure 1 reports the total imports and exports of high-tech products and their percentage of total imports and exports of the US from 1991-2020. The left axis represents the amount, and the right represents the percentage. The yellow and green lines respectively represent the percentages of high-tech imports (exports) in all imports (exports). The blue and orange are total imports and exports. Comparing the blue and orange lines, we see a long-running trade deficit. The light blue and light green represent the import and export of high-tech products. As with overall trade, high-tech trade has experienced a deficit for the past 20 years. Finally, the yellow and green lines represent the proportions of high-tech imports and exports. The percentage of both have declined year after year; since 2009, the percentage of high-tech imports has been much higher than for exports.
The chart shows that under the trend of globalization, the American tech industry only focuses on R&D and benefits from its patents, while moving manufacturing abroad, or else commissioning fabless models, then shipping the resulting end products back to the US. Therefore, trade of high-tech products has remained in deficit. It is worth mentioning that income from patents is classified as service exports, which explains why the United States has enjoyed a surplus in service trade over the years. This surplus makes up for nearly one-third of the deficit in merchandise trade.
Figure 1 shows that the percentage of high-tech products in total trade has gradually declined – precisely the opposite of Taiwan's tech-oriented export expansion. Does this represent a decline in international market competitiveness of the US high-tech industry? This is hard to judge. Take Apple’s iPod as an example. Scholars such as Dedrick (2010) analyzed that within the US$144 ex-factory price, the added value of parts made in China was less than 10%. Nearly US$100 of added value is shared by Japanese and Korean manufacturers. However, in the trade account, the US indeed has a deficit in iPod products. Therefore, globalization research should focus on analysis of global value chains.

From the perspective of international division of labor, this phenomenon is a concrete and subtle reflection of the reverse movement of the entire manufacturing industry between the North and the South. Globalization has accelerated the de-industrialization of advanced economies, and developing countries have absorbed their technology. As a result of continuous industrialization, low-end high-tech production technology has been shared, so that the world's factories are now found in developing countries. Therefore, trade deficit data alone cannot explain a country's international competitiveness.
An important partner for high-tech trade
Using USITC statistics, this article analyzes the eight most important trading partners of the US: the EU, Canada, China, South Korea, Japan, Mexico, Taiwan and the United Kingdom. These partners accounted for 70.68% of US imports of high-tech products on a 5-year average from 2016-2020, and 81.88% of exports. Therefore, these partners should be representative for analyzing the high-tech product trade between the US. Figure 2 shows the high-tech import/export ratio of the US with these countries.
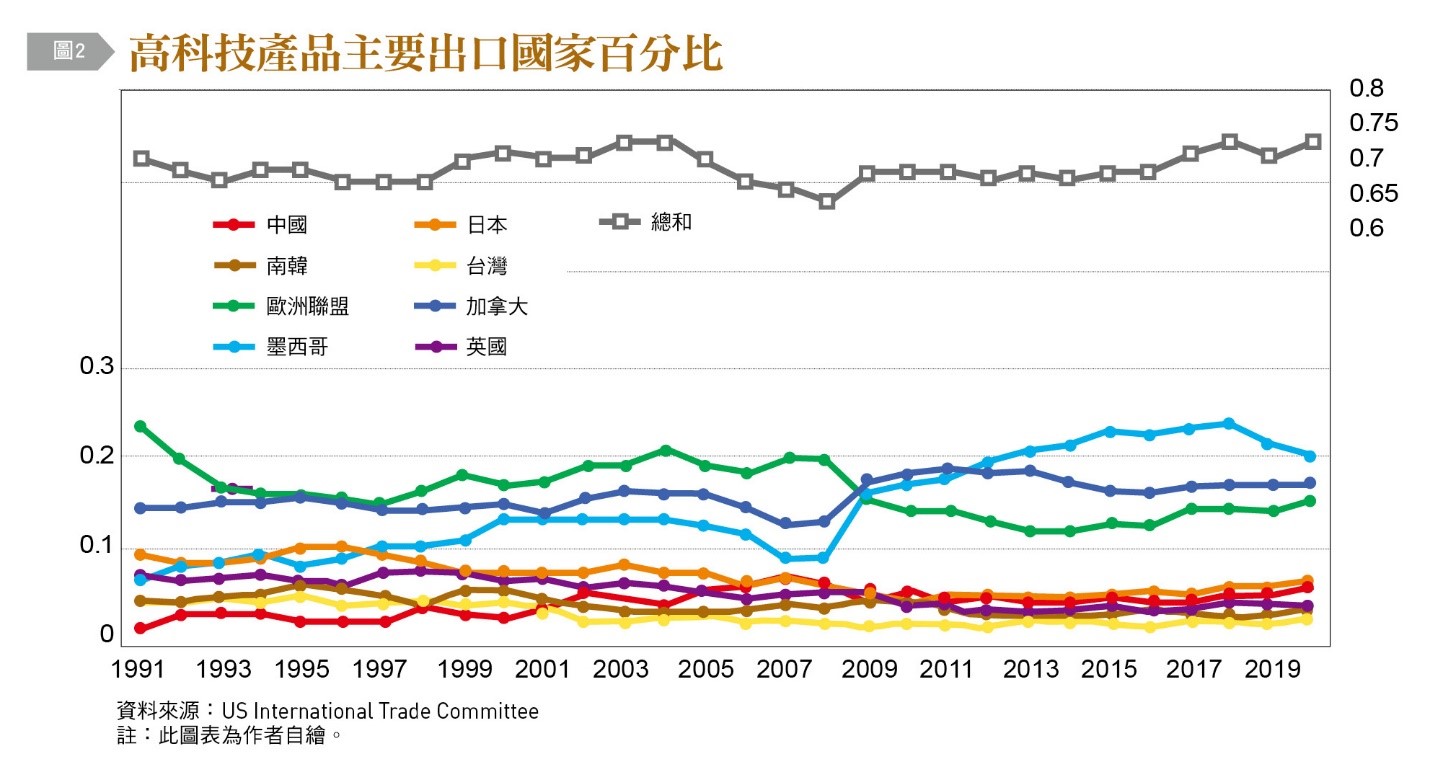
The diagram shows that over 60% of US high-tech exports over the past 30 years went to these partners. The EU, Canada, and Mexico are the three biggest of these partners. Over the past 10 years, exports to Canada and Mexico have surpassed those to the EU. Exports to China increased from a five-year average of 2.38% from 1991-1995 to 4.78% from 2016-2020. However, exports to Taiwan have declined year by year. From 1991-1995, they accounted for 4.3% of total exports, but only 1.88% from 2011-2015. A similar situation also occurred with Japan and South Korea. From 1991-1995, exports to Japan accounted for 8.82%, but only for 4.8% from 2016-2020. During the same period, exports to South Korea also dropped from 4.74% to 2.98%.
Figure 3 shows the proportions of high-tech importers. Over the past 20 years, these countries have accounted for more than 80% of imports, and imports from Mexico and the EU have generally remained at about 20%. One of the most obvious phenomena is that imports from Japan have decreased, while China has continued to increase. From 2016-2020, China accounted for 20.14% of all high-tech imports, but Japan only accounted for 7.14%; South Korea dropped from 6.46% in 1991-1995 to 3.86% in 2016-2020. However, Taiwan’s decline was almost two-thirds, from 7.42% from 1991-1995 to 2.52% from 2016-2020.
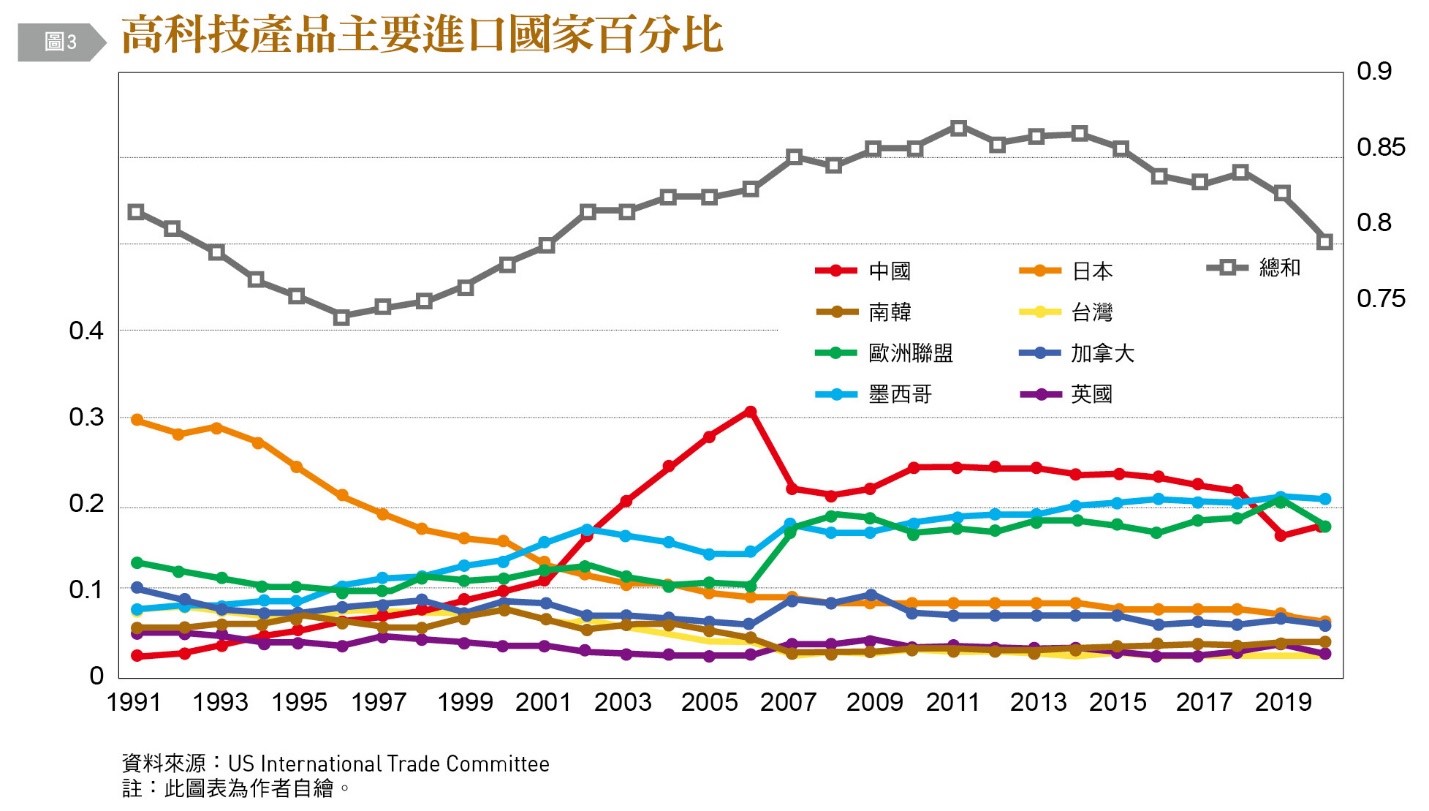
From a geo-economic perspective, the proportion of high-tech imports by the US from East Asian countries has remained above 40% in the 20 years from 1991-2010. Over the past 10 years, imports from Taiwan, Japan, China and South Korea have also remained above 30%. However, the proportion of imports from China has increased, taking the place of imports from Taiwan, Japan, and South Korea. This phenomenon can specifically illustrate the continued internationalization of Taiwan, Japan, and South Korea’s high-tech industries, while some production bases have been moved to China, but the end market is still the US. Because many high-tech products relate to national security, when the US-China trade war escalated into a technology war, the Trump administration became particularly concerned about over-reliance on Chinese imports. This is why in mid-February, the Biden administration ordered a full review of global supply chain resilience.
ICT industry vulnerability index
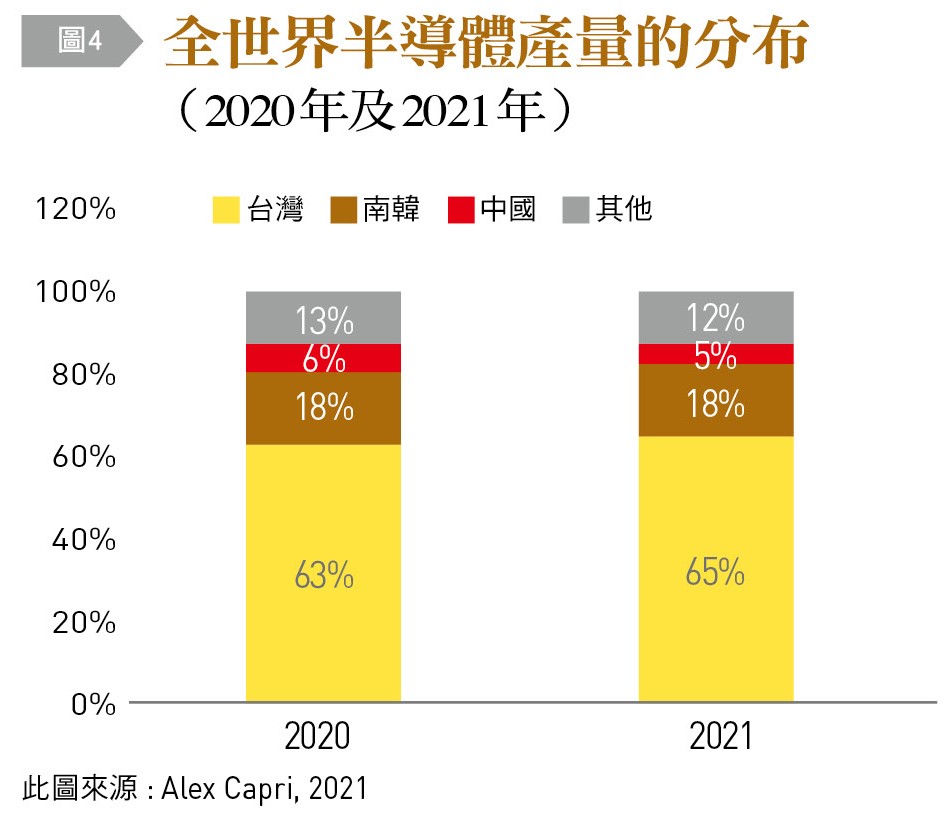
First, the global output value distribution of the most important high-tech semiconductors over the past two years are used to illustrate the concentration of this industry. From 2020-2021, Taiwan, China, and South Korea increased their combined portion of global semiconductor from 87% to 88%. Taiwan’s output increased from 63% of the world’s output in 2020 to 65% in 2021. South Korea has remained at 18% for the past two years, while China dropped from 6% in 2020 to 5% in 2021. Although Taiwan’s semiconductors dominate, and TSMC has become a ‘commanding height’ of its economy, from a geopolitical point of view, semiconductor production is concentrated in East Asia, and China continues to challenge Taiwan’s survival and development. The US is over-reliant on imports from Taiwan, which must be considered a national security risk.
Global supply chain risk is systemic, which means unrelated to any particular source, but rather contained within the supply chain itself. Some scholars have established a “vulnerability index” based on degree of supplier concentration, including both companies and countries.
Detailed firm-level big data and input-output analysis is required to build vulnerability indices for each industry. In a report submitted to the US-China Economic Security Council, Beeny and other scholars used vendors that provide federal ICT products to perform input-output analysis (including the location of intermediate and downstream suppliers) based on reports required by the federal government. That is, the higher the vulnerability index of the ICT industry to major trading partners, the greater the risk, and the higher the risk of supply chain failure.
This article takes seven well-known tech giants as a sample: Microsoft, Dell, Intel, Cisco, IBM, Hewlett-Packard and Unisys. The degree of dependence on a certain country was calculated based on the origin of their products (including intermediates) from 2012-2017 to build vulnerability indices for these countries. The countries are China, Hong Kong, Singapore, Taiwan, Malaysia, Thailand, Japan and South Korea.
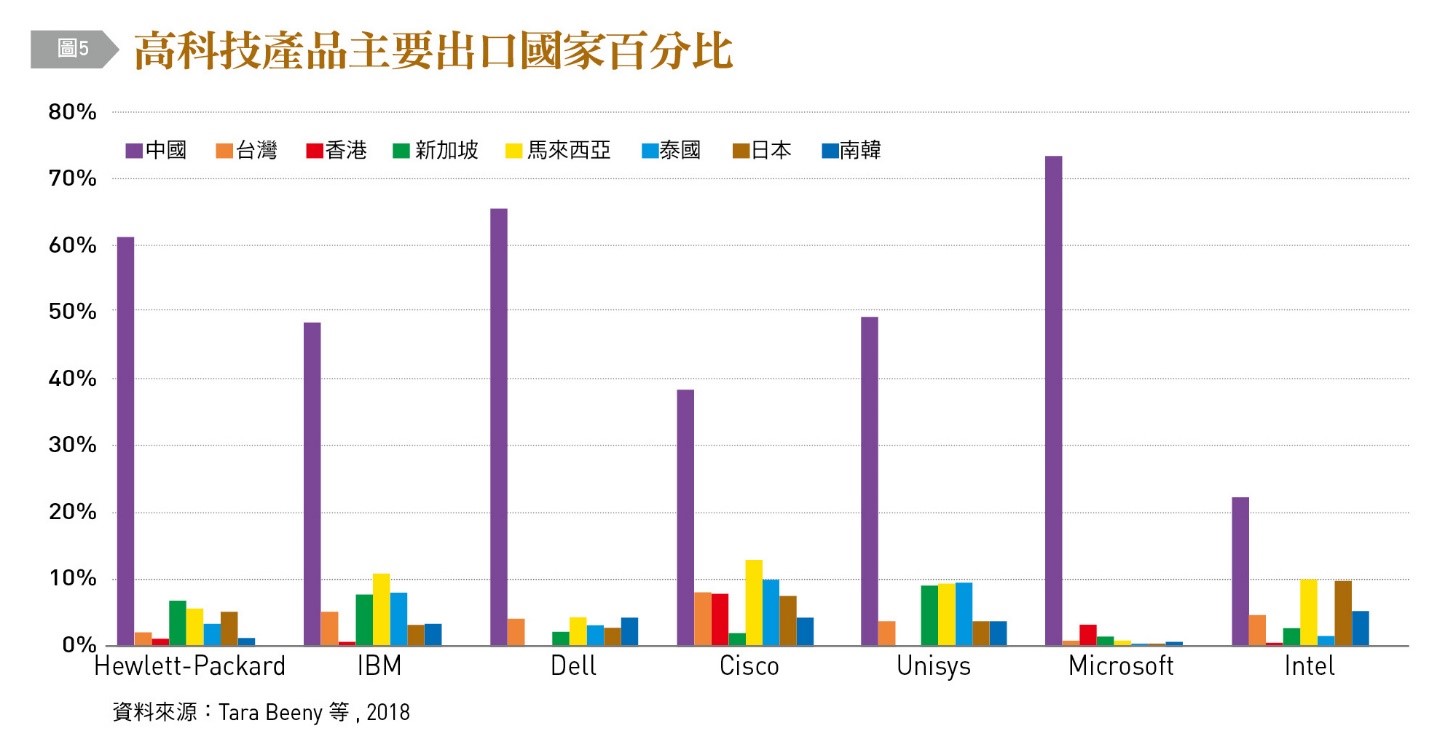
The diagram shows that on average, more than half of the supply of these vendors came from China. Among them, Microsoft is most exposed to China risks (73%). Dell and Hewlett-Packard are both more than 60% dependent on China. End products from Taiwan and Singapore also contain many parts produced in China. This phenomenon may be just the tip of the iceberg. In addition to ICT products, the United States is also highly dependent on imports for medical equipment and scientific brand-name drugs, and the exporters are concentrated in China and India. This is particularly worth thinking about as the US-China trade war escalates and COVID causes supply chain bottlenecks.
The author of this article is a professor of economics at New York City University